How is the Australian innovation system tracking in 2024?

Read analysis on how the Australian innovation system is changing

Innovation is the process of creating new knowledge and technology and adopting it across the economy. It is a key driver of productivity, economic growth and a higher standard of living. 

The newly published Australian Innovation Statistics (AIS) contains 6 data dashboards on aspects of the Australian innovation system. The metrics in the AIS highlight the resilience of Australian innovators. Despite challenging business conditions in recent years, Australian innovation has continued to grow.

We drew out some key messages from these data. 

Australian innovation is growing 

Australia’s innovation continue to grow relative to pre-pandemic levels and there has been an increase in the number of businesses engaged in innovation. Australia performs well compared to our Organisation for Economic Co-operation and Development (OECD) peers. This is despite ongoing challenges around access to finance and skills.

Chart one shows almost half (45.7%) of Australian businesses took part in innovative activities in 2022–23. These figures are the highest recorded over the last decade, excluding a surge during the pandemic, which drove an intense period of innovation. Australia performs well to its peers on this metric, ranking 7 out of 39 countries in the latest OECD innovation survey, held in 2023.

The Innovation Outcomes dashboard shows that the highest levels of activity were in the ICT, manufacturing and wholesale trade industries. For example, in 2022-23, the share of firms that were innovation-active in each of these industries was more than 50 per cent (ABS 2024a). Australian innovation-active businesses continue to self-report more productivity gains and better performance on other criteria like taking part in social causes, compared with non-innovation peers (ABS 2024a).

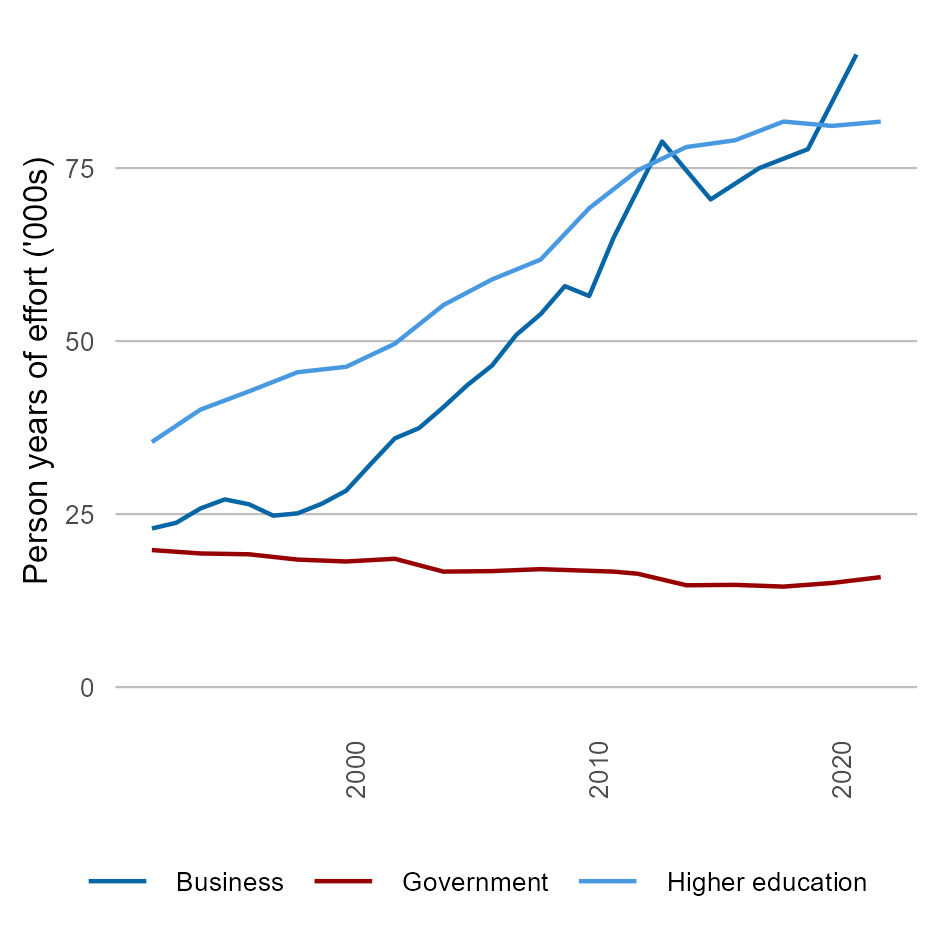
These trends coincide with changes in a range of factors that help business innovate. For example, data on human capital and skills in chart 2 shows that up to 2022 (the most recent data) business and higher education sectors had record high employment rates for research and development (R&D) specialists.

The collaboration dashboard shows increased interaction on innovation between customers, suppliers and consultants, and increasing rates of international co-authorship on scientific publications across all fields (ABS 2024a). For example, the proportion of Australian publications in Engineering and Technology with international co-authorship has surged from 23% to 74% of publications between 2000 and 2023 (Clarivate 2024).

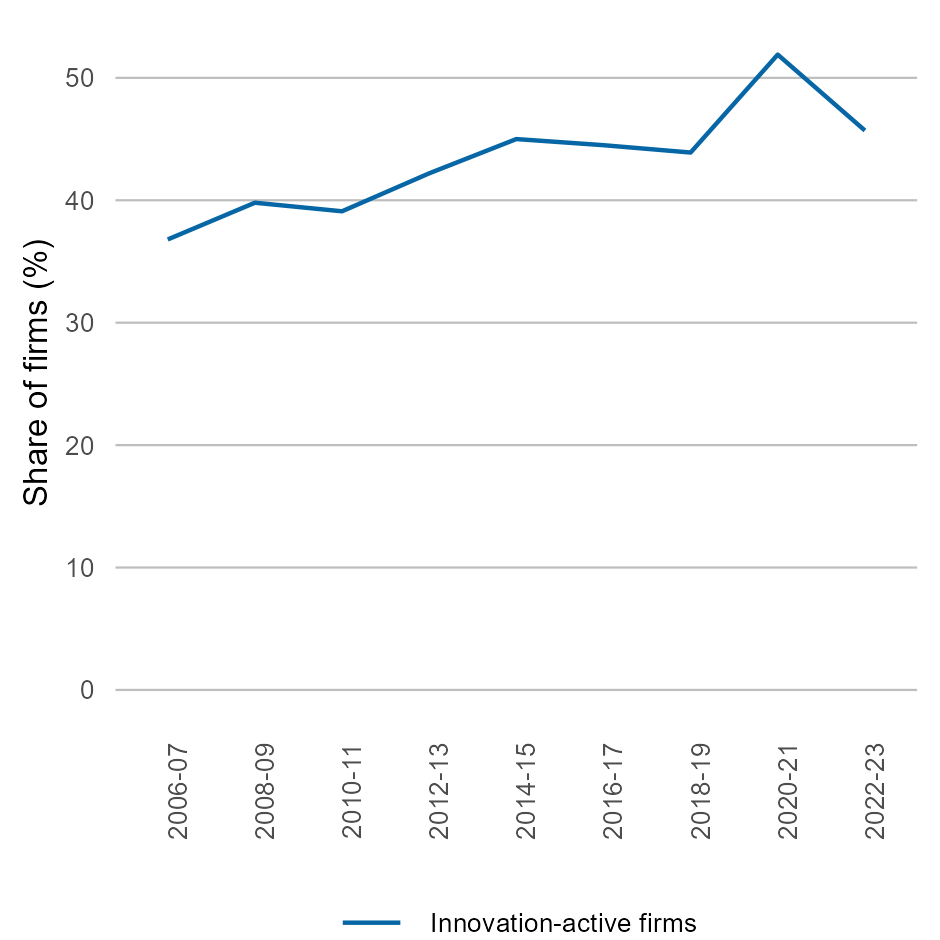
Innovation-active businesses in Australia

full description follows

An innovation-active firm is any firm that took part in any work that intended to, or did, result in the introduction of an innovation. Source: ABS Cat Nos. 8167 and 8158

Human resources devoted to R&D

full description follows

Government includes Commonwealth, state and territory employees. Source: ABS Cat. Nos. 8104, 8109, 8111

Diffusion remains the main model of innovation

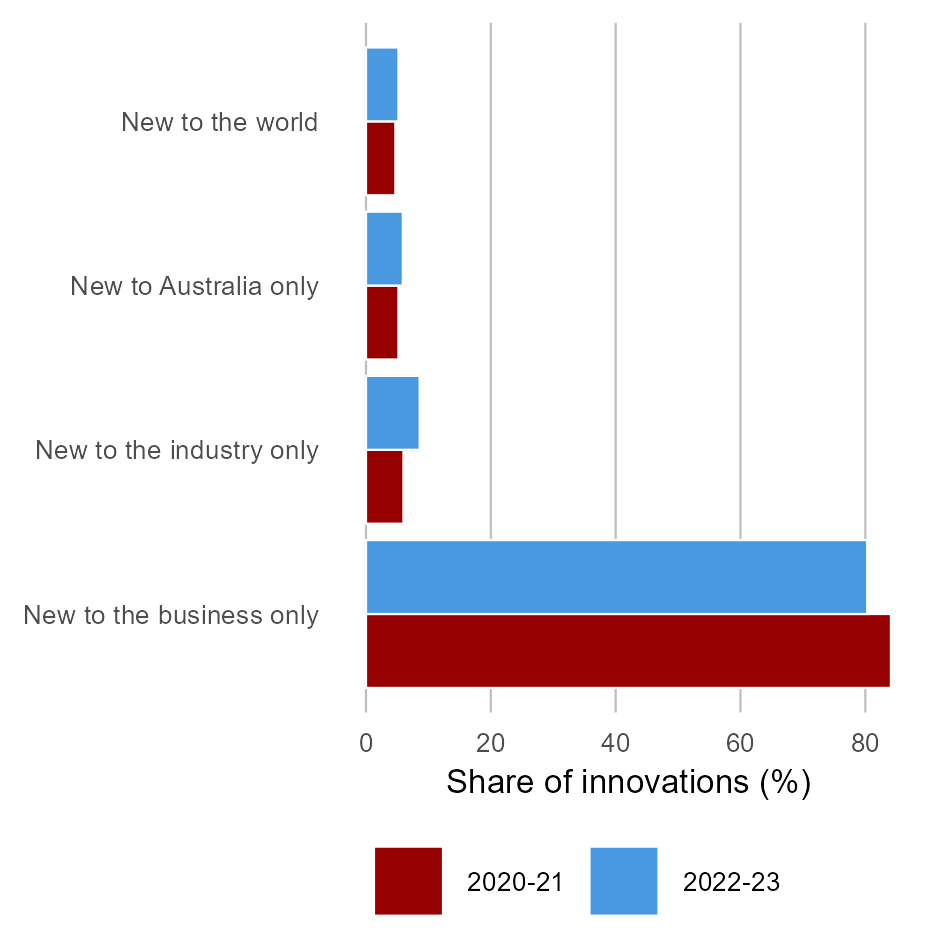
Australia’s innovation model is still one of diffusion. Chart 3 shows that in 2022–23, 94.8% of innovations adopted by Australian business were existing. Although, in this context there are signs of increased innovation creation. The number of new to world innovations produced in Australia has increased since the pandemic, up to 5.2% in 2022–23 from 4.7% in 2020-21. 

Australian businesses innovate while facing a challenging landscape

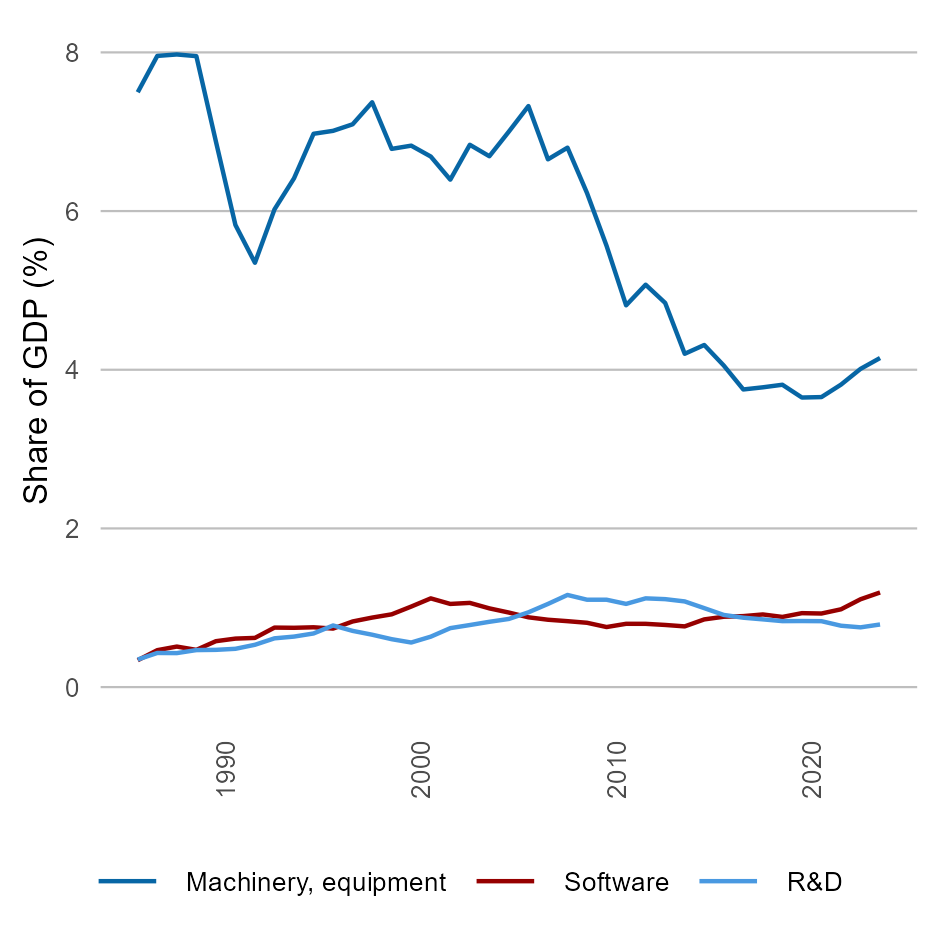
Australia’s positive innovation performance has come despite a backdrop of challenging business conditions. For example, innovation relies on software, machinery and R&D investment to take advantage of both existing technologies, and to develop new ones. But Australia has seen either a decline or low growth in these knowledge-intensive types of capital as a share of GDP since the mid-1990s. Chart 4 shows this decline and that investment growth has picked up since 2021 in machinery and equipment, and software.

Skills acquisition, and matching businesses with sources of finance, both remain the most common barriers to innovation for businesses. In 2022– 23, the most frequently reported barriers to innovation as part of the Business Characteristics Survey were ‘lack of skills’ (23.2 per cent of respondents) and ‘lack of access to additional funds’ (19.1 per cent of respondents) (ABS 2024a). The lack of access to additional funds is likely to reflect, at least in part, challenges in firms that are seeking finance for innovation matching with firms that provide finance.

Novelty of innovations adopted by Australian businesses

full description follows

An innovating business is one that introduced any type of innovation during the reference period. 'New to the world' innovations are the most novel, while innovations 'new to the businesses only' are the least novel. Similar survey data for earlier time periods is not directly comparable with the chart. Source: ABS Cat No. 8158

Expenditure on knowledge-intensive capital

full description follows

Knowledge-intensive capital includes the ideas and processes produced by investment in software and R&D, and the technology embodied in machinery and equipment. Source: ABS 2024c

Sources

ABS (2024a), Innovation in Australian Business, ABS website, accessed 31 August 2024.

ABS (2024b), Research and Experimental Development, Higher Education Organisations, ABS website, accessed 31 August 2024

ABS (2024c), Australian National Accounts: National Income, Expenditure and Product (1986 to 2023), ABS website, accessed 31 August 2024

Clarivate (2024), InCites Dataset, accessed 31 August 2024

OECD (2023), Survey of business Innovation Statistics and Eurostat’s Community Innovation Survey (CIS-2020).