The Australian Government is now operating in line with Caretaker Conventions, pending the outcome of the 2025 federal election.
Business competition and investment encourage the creation and adoption of new ideas and technologies.
Firm entry and exit rate, employing firms
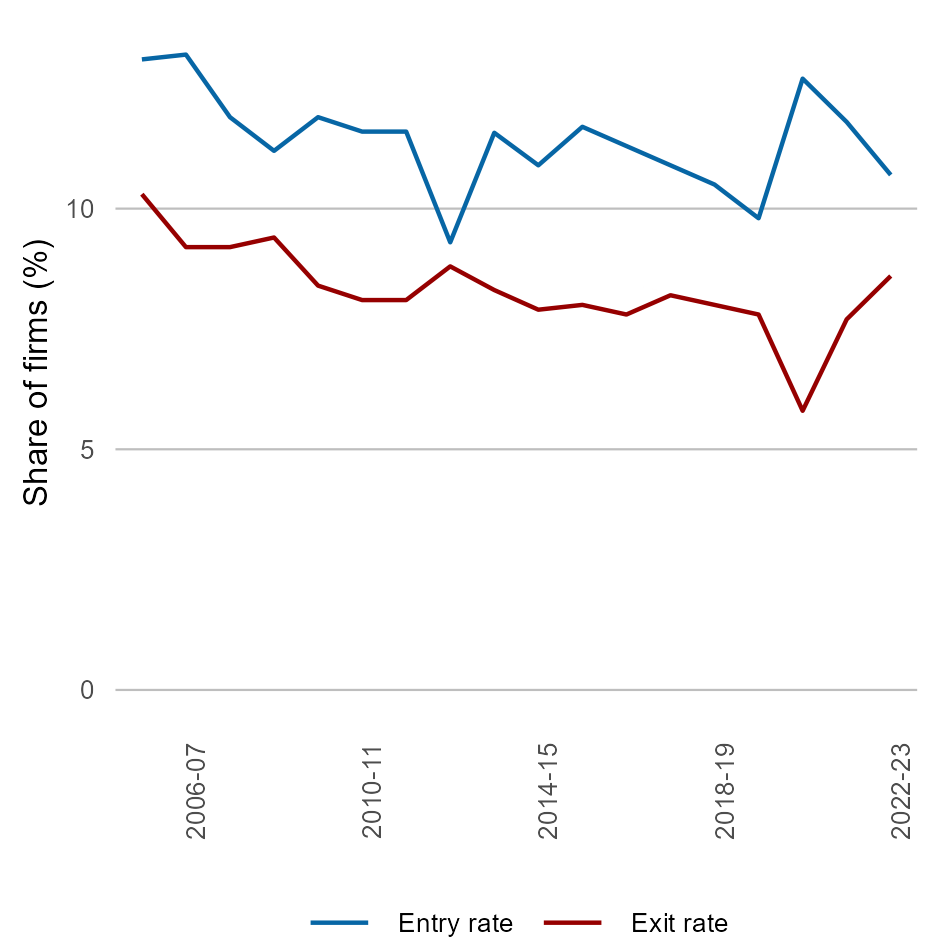
The rate of firm entry and exit, an indicator of competition, has trended downward for employing firms over time. Source: ABS 2007, 2010a, 2014a, 2018a, 2019b, 2022a, 2023c
This chart shows the rate of firm entry and exit for employing firms from 2005–06 to 2022–23.
Over this period, the rate of firm entry and exit has trended downward. In 2005–06 the rate of firm entry was 13.1%, this has fallen to 10.7% in 2022–23. In 2005–06 the rate of firm exit was 10.3%, this has fallen to 8.6% in 2022–23.
Barriers to innovation commercialisation, 2022–23
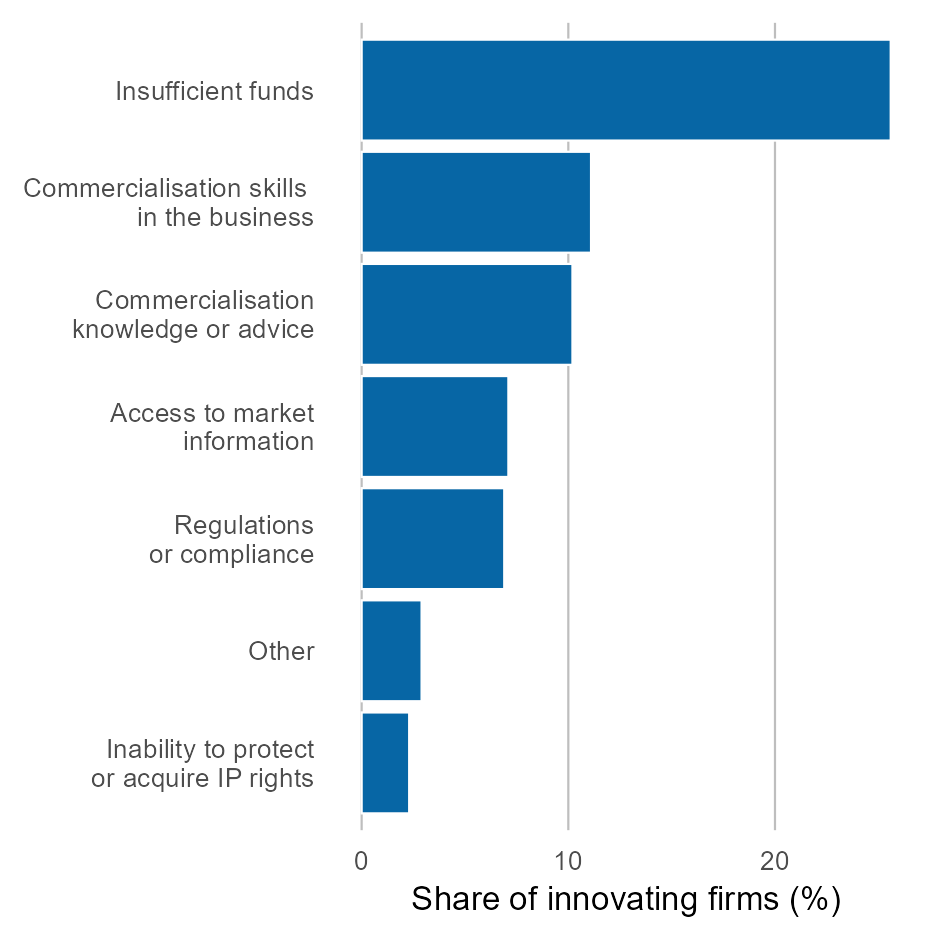
The most common barriers to commercialisation are insufficient funds and lack of commercialisation skills within the business. Note: Firms were able to select multiple barriers. Source: ABS 2024c
This chart shows the barriers to commercialisation for the most significant innovation of innovating firms for the 2022–23 period. The most frequent barriers to commercialisation were insufficient funds for 25.6% of innovating firms and lack of commercialisation skills within the business for 11.1% of innovating firms. The least frequent barrier to innovation was inability to protect or acquire IP rights for 2.3% of innovating businesses.
Barriers to firm innovation
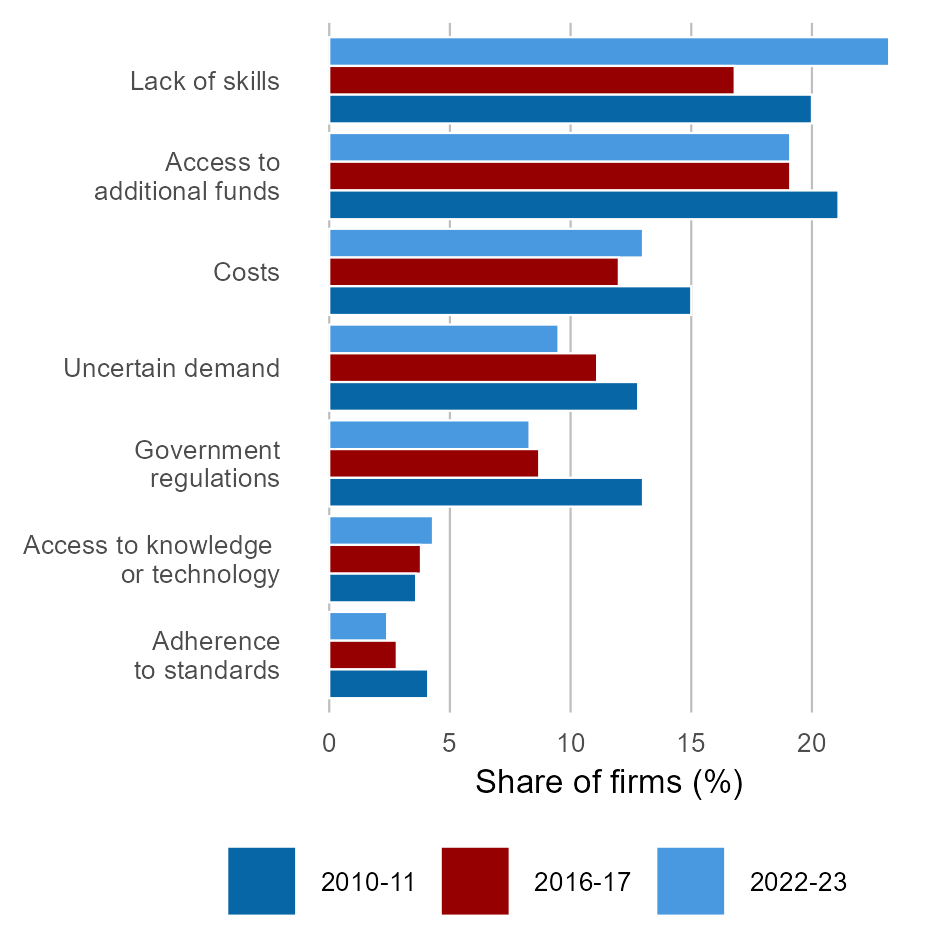
The most common barriers to innovation are lack of skills and access to additional funds. Source: ABS 2012a, 2018c, 2024c
This chart shows the barriers to innovation for all firms (innovation-active and non innovation-active firms) for 2010–11, 2016–17 and 2022–23. Over this period the proportion of firms impacted by five of the seven barriers listed fell. The proportion of firms who experienced lack of access to additional funds and lack of access to knowledge or technology as barriers increased over this period. In 2022–23 the most frequent barriers to innovation were lack of skills (23.2%) and lack of access to additional funds (19.1%).
The least frequent barriers to innovation for firms were adherence to standards (2.4%) and lack of access to knowledge or technology (4.3%).
Venture capital, deals and aggregate deal value
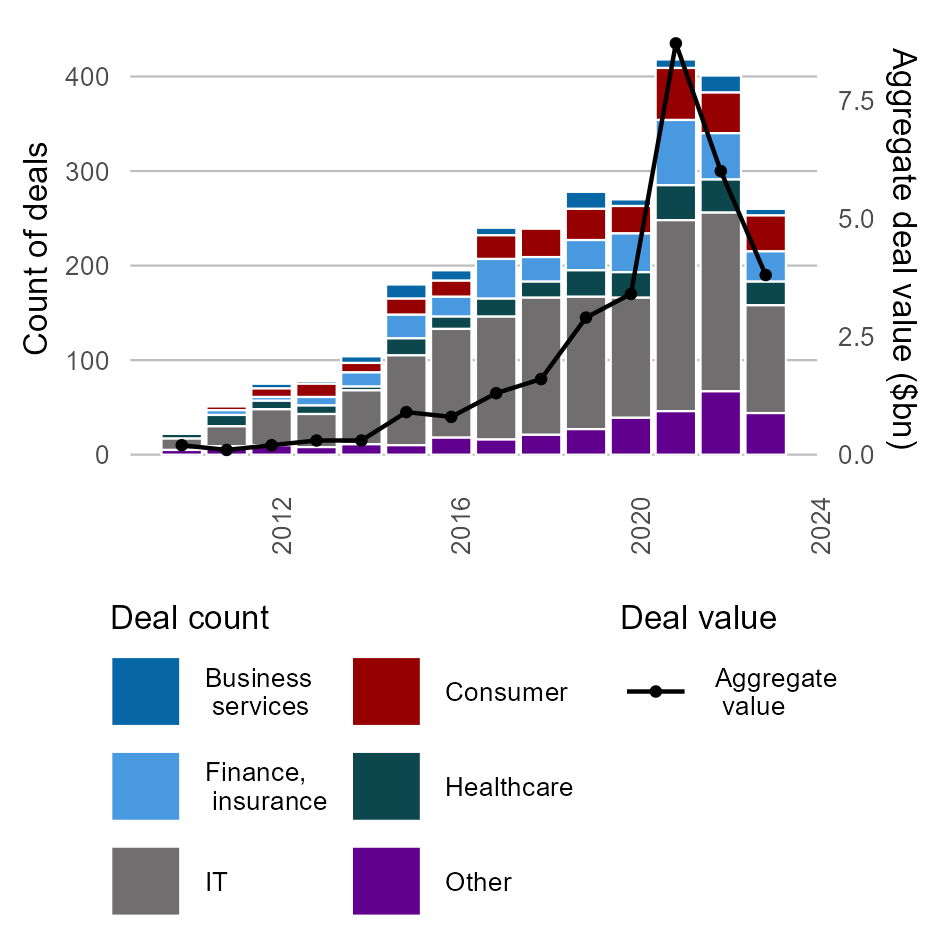
The total venture capital deals have increased from 2010 to 2023, along with the overall value of these transactions. Alternative data sources on venture capital show similar trends. Source: AIC/Preqin 2024
This chart shows the number and value of venture capital deals in Australia from 2010 to 2023.
The number of venture capital deals has risen from 23 deals in 2010 to 260 deals in 2023.
In this period the information technology group had the largest number of venture capital deals.
From 2010 to 2023, aggregate venture capital deals value has risen from $0.2 billion to $3.8 billion. The aggregate value of venture capital deals was highest in 2021 at $8.7 billion.
Knowledge-intensive capital investments, by category
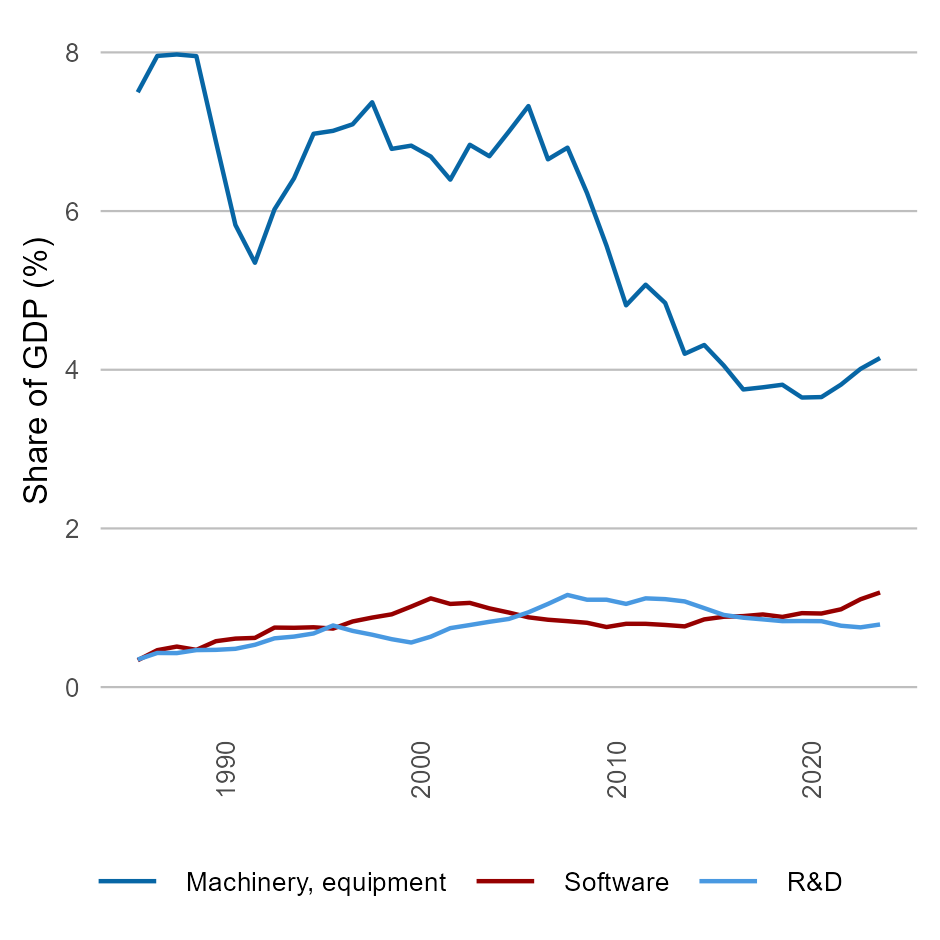
Australia has seen either a decline or low growth in knowledge-intensive types of capital as a share of GDP since the mid-1990s. Machinery and equipment hold the largest share of capital spending. Investments in computer software and research and development have remained stable. Investment growth has picked up since 2021 in machinery and equipment, and software. Source: 2021a
The metric presents the percentage of capital spending in three categories including machinery and equipment, computer software and research and development as a portion of the GDP from 1986 to 2023. Machinery and equipment have the largest share. Investment in this category has been declining since 2006, falling from 7.3% to 4% by 2023. Meanwhile, investments in computer software and research and development have stabilized at approximately 1% and 0.75%, respectively.
Firms seeking finance for innovation
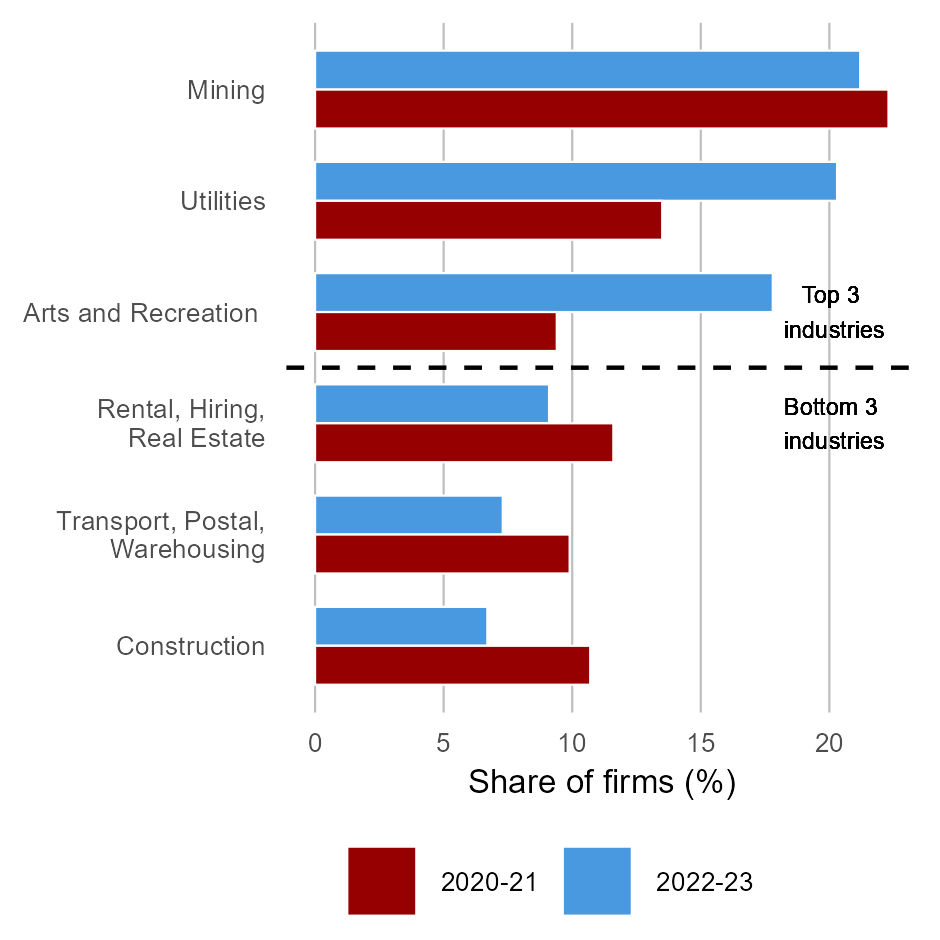
Mining, utilities and arts and recreation industries have the highest proportion of firms that seek for funds for innovation. The middle 11 industries in 2022–23 are not included in this chart. Source: ABS 2022c, 2024c
This chart shows three industries with the highest proportion of firms that sought funds for innovation, and the three industries with the lowest proportion of firms that sought funds for innovation from 2020–21 to 2022–23.
In 2022–23 the mining industry had the most firms who sought funds for innovation at 22.2%, and the construction industry had the least firms who sought funds for innovation at 6.7%.
