These technologies are used to manufacture and modify materials in ways that improve their performance. Advanced materials may be used for their structural properties or functional ones like chemical, magnetic or electrical properties.
Example technologies
- Additive manufacturing, including 3D printing
- Critical minerals extraction and processing
- Advanced composite materials
- High-specification machining processes
- Semiconductors and advanced integrated circuit design and manufacture
Example applications
These technologies can be used for:
- safely storing and transporting liquids and gases, such as hydrogen
- better composite structures
- compact emergency distress beacons
- detecting toxic gases
- ultra-thin antennas
- advanced flexible, printable and highly durable photovoltaic cells
- personalised biomedical devices, including improved orthopaedic devices
- specialised semiconductors and thermal and radiation-resistant materials, for use in space and other environments where reliability is important
- stronger, lighter vehicle components, including advanced aerospace propulsion hardware.
Global research trends
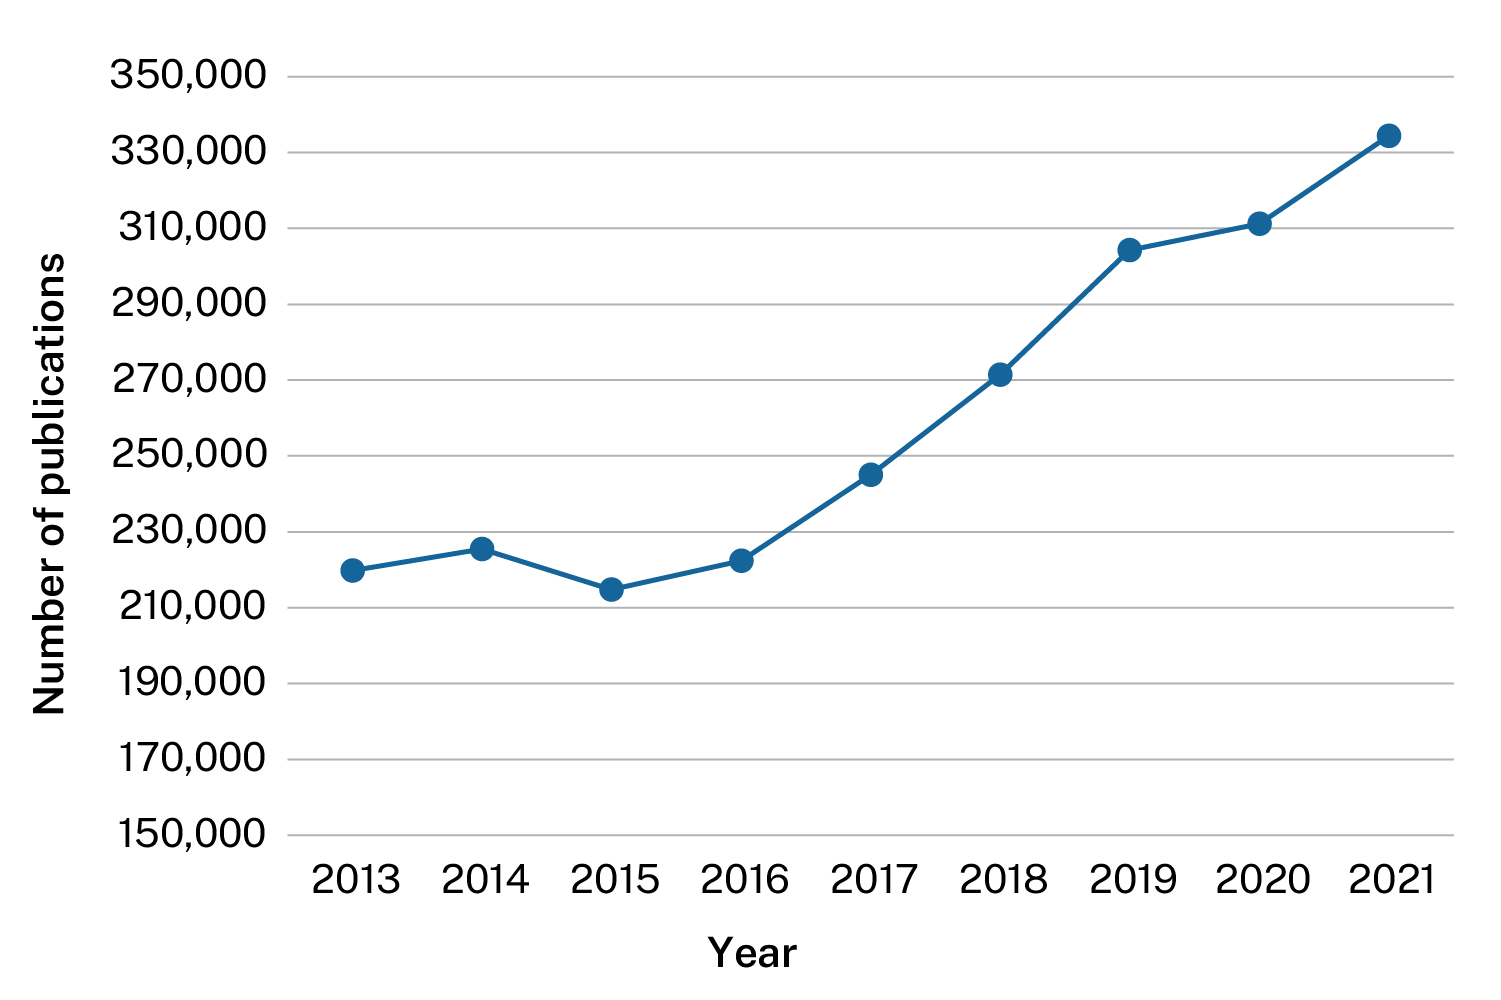
Research into advanced manufacturing and materials has been growing steadily since 2015, with over 330,000 publications published around the world in 2021.
Number of advanced manufacturing and materials research publications published globally each year, 2013–2021
Global research rankings
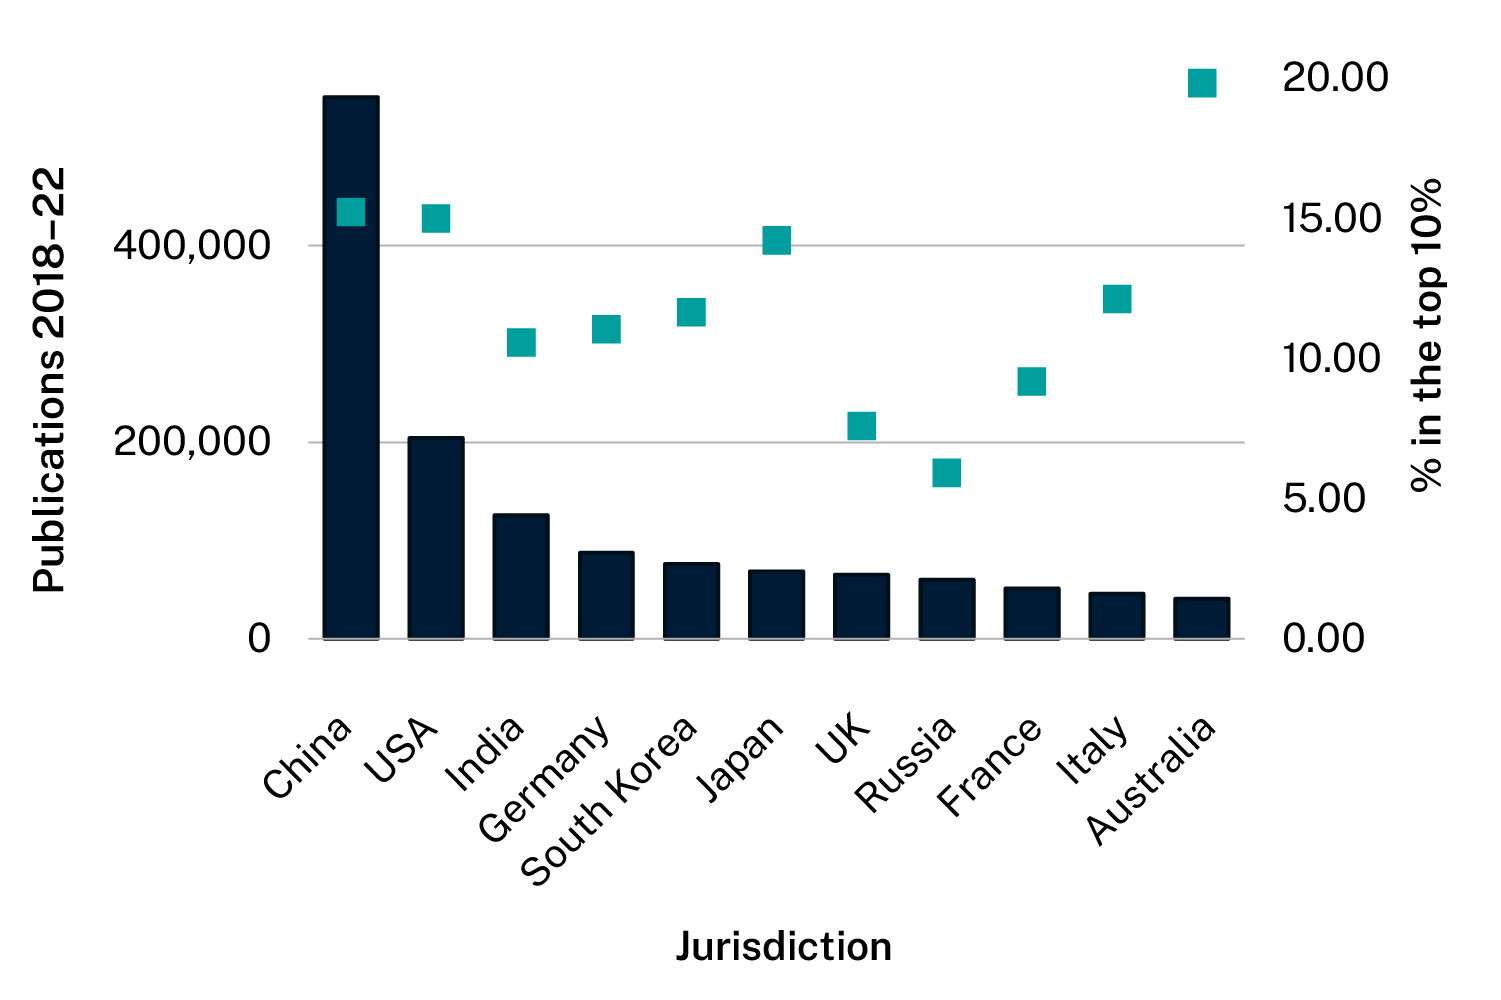
China and the United States do the most advanced manufacturing and materials research.
The graph below shows the number of publications each jurisdiction published between 2018 and 2022. It also shows what proportion of each jurisdiction’s publications were ranked in the top 10% of publications worldwide. This is based on how often the jurisdiction’s publications on core advanced manufacturing and materials research subjects were cited.
Advanced manufacturing and materials publications by jurisdiction, 2018–22
Show text version
|
Ranking |
Jurisdiction |
Publications, 2018 to 2022 |
Percentage in top 10% |
|---|---|---|---|
|
1 |
China |
551,074 |
15.24% |
|
2 |
USA |
204,414 |
15.01% |
|
3 |
India |
125,533 |
10.59% |
|
4 |
Germany |
87,517 |
11.05% |
|
5 |
South Korea |
76,113 |
11.66% |
|
6 |
Japan |
68,422 |
14.23% |
|
7 |
UK |
64,939 |
7.61% |
|
8 |
Russia |
60,143 |
5.92% |
|
9 |
France |
51,272 |
9.19% |
|
10 |
Italy |
45,741 |
12.14% |
|
11 |
Australia |
40,507 |
19.84% |
Commercialisation
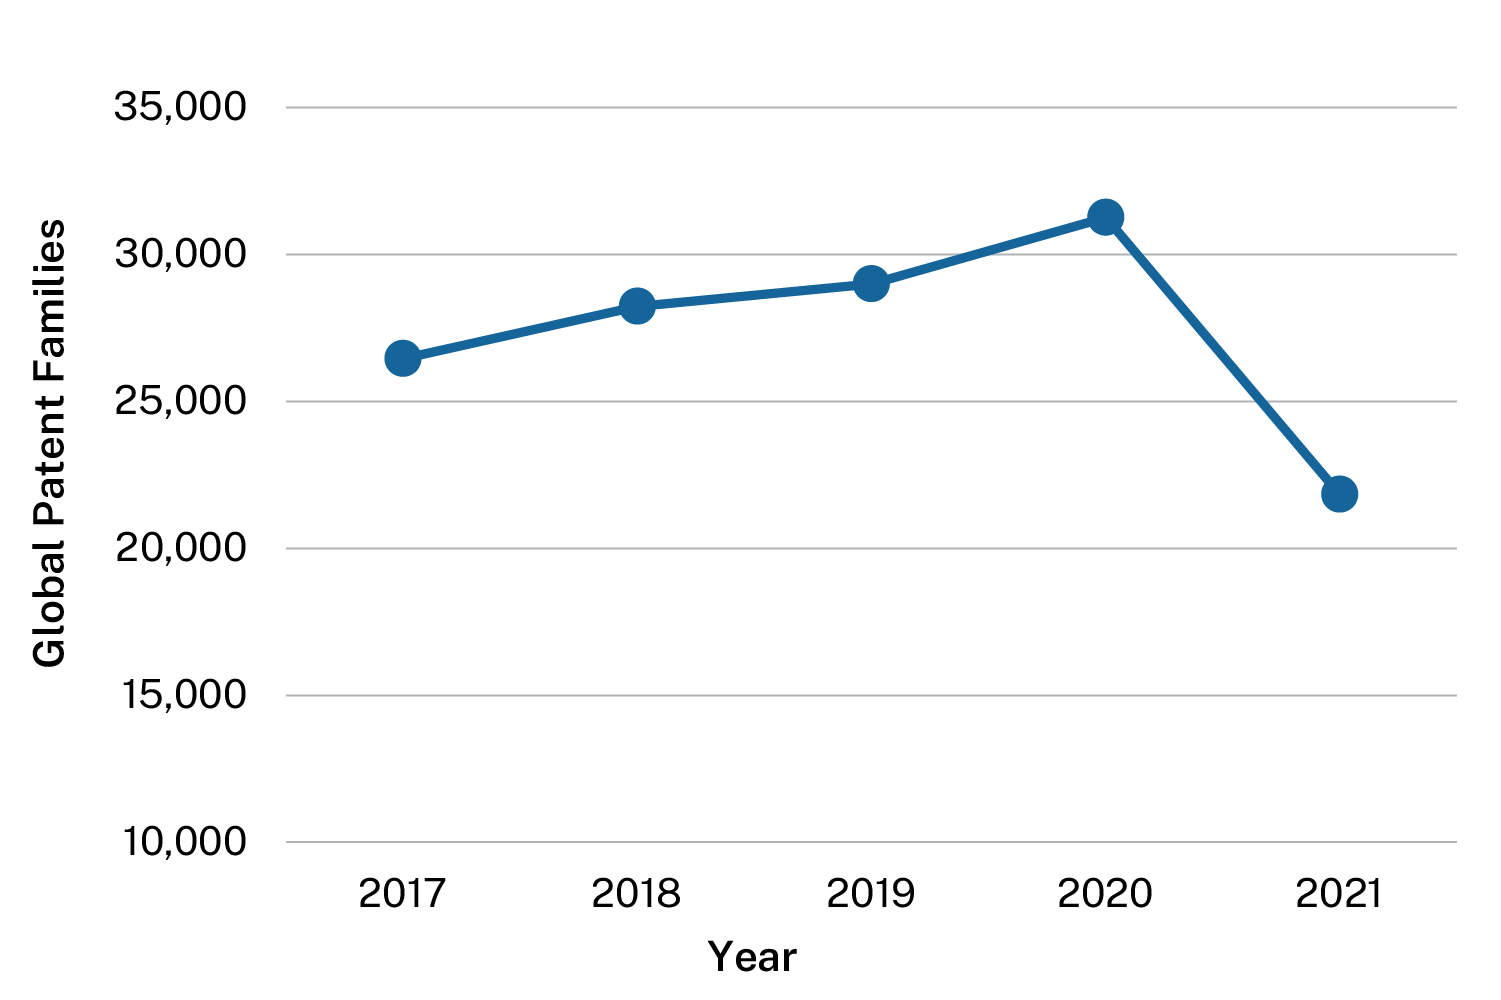
Patent filings are a way to measure how innovation is being commercialised. Patent data can also be used to identify potential collaborators and export markets.
The graphs below show numbers of patent families filed. A patent family is a set of patents filed in different jurisdictions for the same invention.
Advanced manufacturing and materials patent families filed globally each year, 2017–2021
Show text version
|
Year |
Global patent families filed |
|---|---|
|
2017 |
26,452 |
|
2018 |
28,234 |
|
2019 |
28,990 |
|
2020 |
31,257 |
|
2021 |
21,825 |
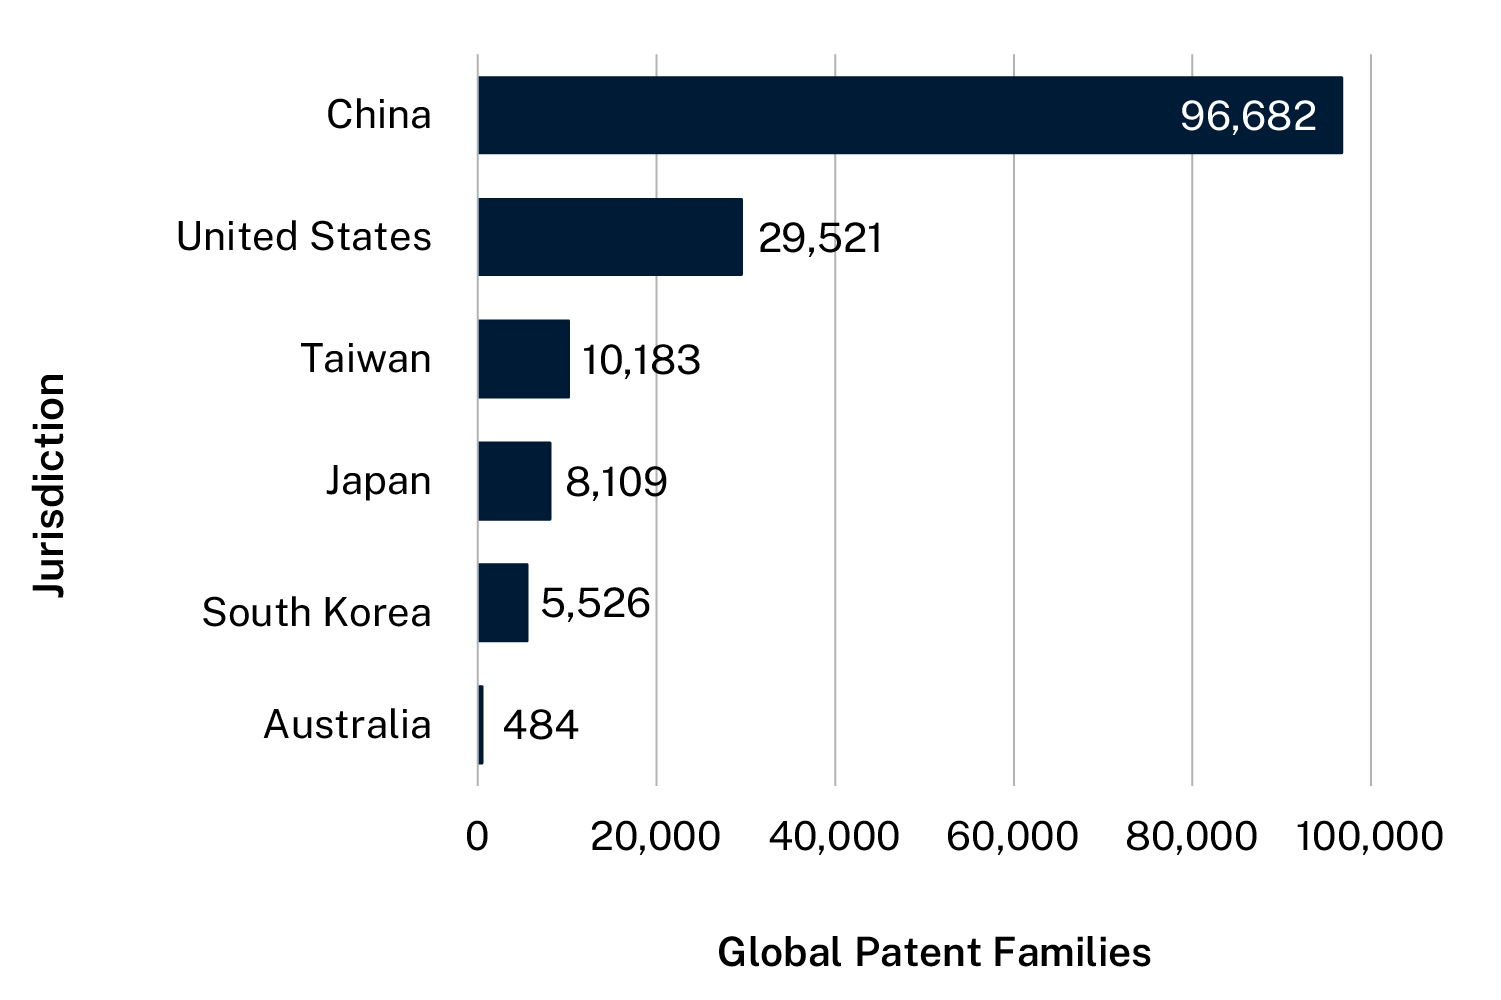
Jurisdiction of origin for advanced manufacturing and materials patent families filed, 2017–2021
Show text version
|
Ranking |
Jurisdiction |
Global patent families filed |
|---|---|---|
|
1 |
China |
96,682 |
|
2 |
United States |
29,521 |
|
3 |
Taiwan |
10,183 |
|
4 |
Japan |
8,109 |
|
5 |
South Korea |
5,526 |
|
17 |
Australia |
484 |
The Australian industry
Australia is at the forefront of research and development in this area. We are a world leader in nanotechnology research funding, and our universities are renowned for their work on advanced materials. Australia’s skilled workforce and natural resources give us an advantage in developing and commercialising new materials.
Advanced manufacturing and materials research output (number of publications) by state and territory, 2018–2022
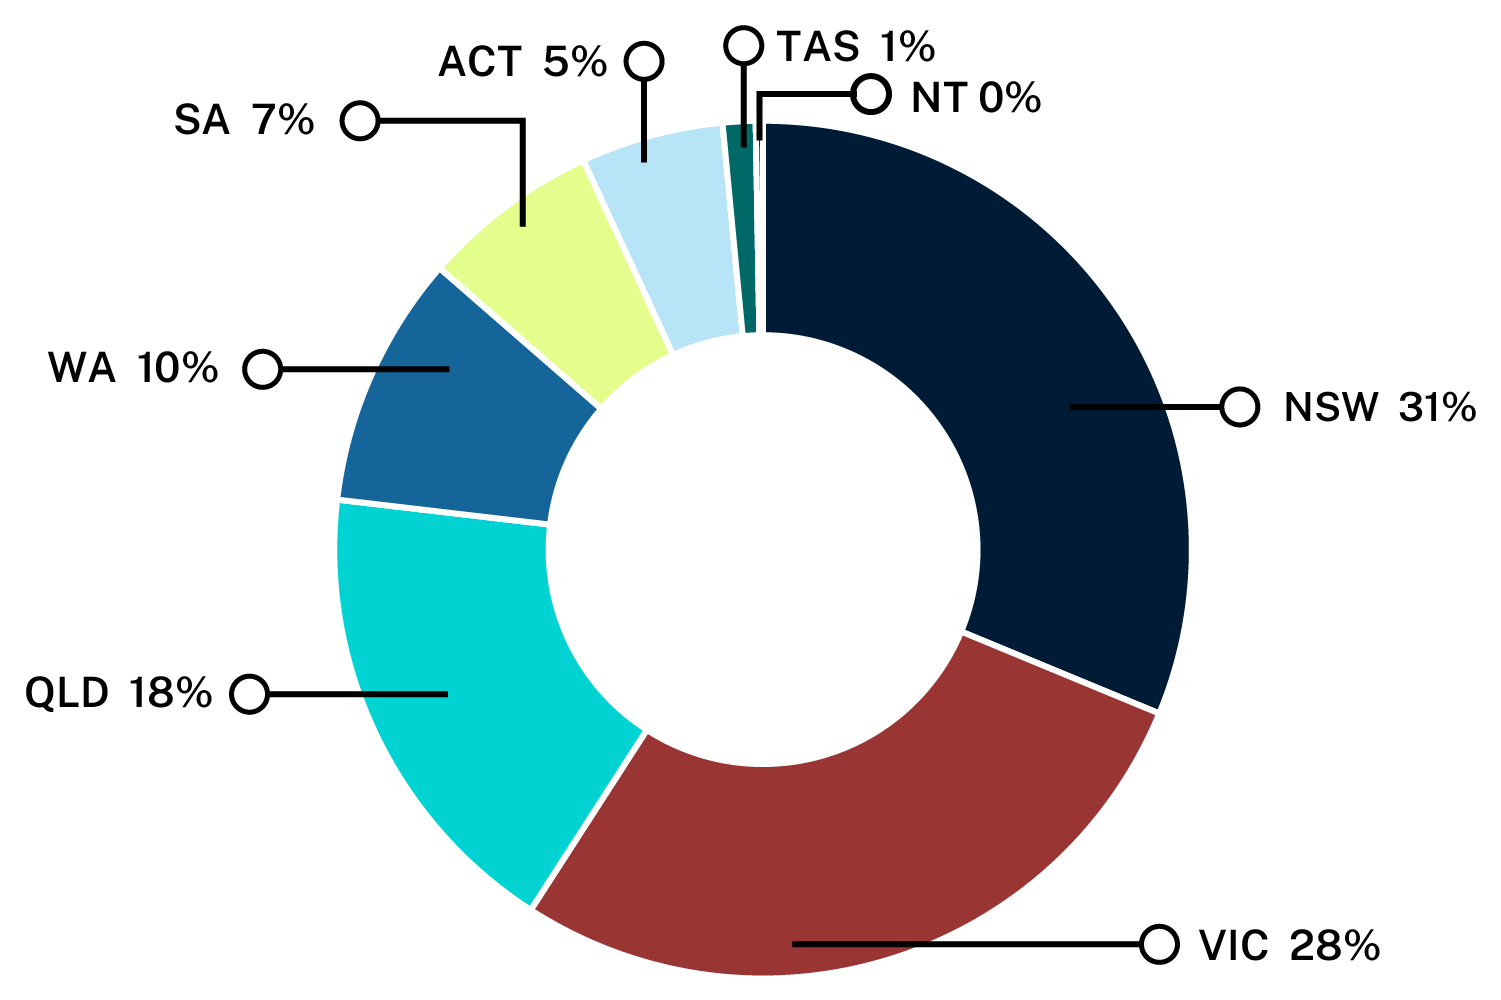
Show text version
- NSW: 31%
- Victoria: 28%
- Queensland: 18%
- ACT: 5%
- Western Australia: 10%
- South Australia: 7%
- Tasmania: 1%
- Northern Territory: less than 1%
Collaboration
The jurisdictions we collaborate with most on advanced manufacturing and materials research are China, the United States, the United Kingdom, Germany and Japan.
Australia’s top 5 global collaborators on advanced manufacturing and materials research, 2018–2022
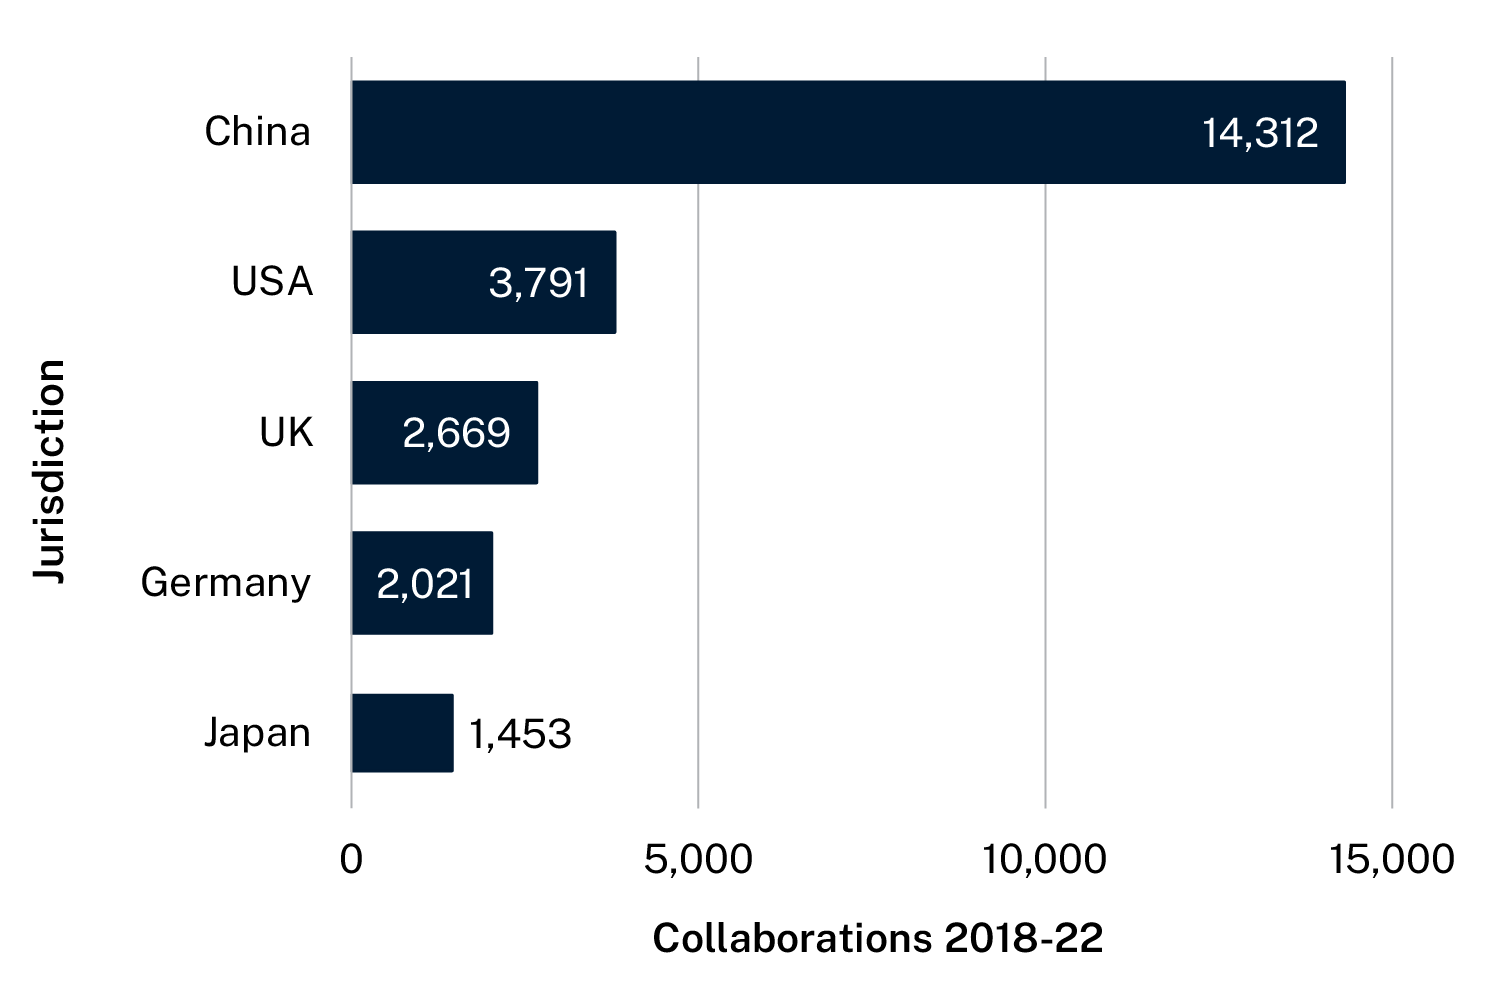
Show text version
- China: 14,312 publications
- United States: 3,791 publications
- United Kingdom: 2,669 publications
- Germany: 2,021 publications
- Japan: 1,453 publications
The Australian Government will support Australian industry to help develop international technology standards for advanced manufacturing and materials.
The future
Advanced materials will underpin new technologies that can be tailored to specific business needs. They will make industries more sustainable by helping businesses improve their energy efficiency and reduce emissions. The sectors that stand to benefit the most are:
- construction
- energy
- biomedicine
- aerospace.
While Australia is a leader in advanced material research and development, we need more investment and expertise to commercialise these solutions.
Strengthening Australia’s advanced materials and manufacturing capabilities will also help us tackle the economic and supply chain challenges we face. Otherwise, we will be dependent on fragile supply chains and exposed to geopolitical shocks.
Market opportunities
Our minerals and metal production sector could add around $9.4 billion to its value by using critical minerals extraction and processing technologies.
Data sources
Publication and citation data on this page was collected from Clarivate’s Web of Science and InCites. Data analysis was performed by CSIRO.
Patent data collection and analysis was performed by IP Australia using data from the European Patent Office’s PATSTAT 2022 autumn edition.